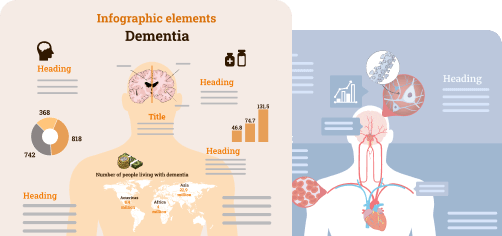
Scientifically Accurate Illustrations
Create science figures, graphical abstracts and infographics for your research. Browse through 75,000+ scientifically accurate illustrations in 80+ popular fields.
- Medical Science
- Microbiology
- Biology
- 80+ Fields of Study
Choose from 300+ pre-made Mind the Graph templates
Built by science designers for Medicine, Biology, Molecular Sciences, and many other fields.
Customizable Graphical Abstracts
Customizable visual representations to boost your manuscript’s quality for publication.

Easily Understandable Infographics
Research indicates a 120% growth in citations for articles using infographics. Because they are a great tool for distilling complex data and content into digestible, engaging visuals.

Impactful Posters
High-quality scientific graphics that capture attention and effectively convey your messages to stand out at any event or environment with visually stunning posters.

Memorable Slide Presentations
Create professional-looking slides for presentation with relevant figures and illustrations for publication.

Experience Mind the Graph Researcher plans and other top research solutions with Editage Plus
Unlimited access to AI-powered tools, exclusive discounts on expert services & much more!
Mind the Graph
Researcher plan benefits
Access to 75,000+ scientific illustrations
Create unlimited scientific illustrations
Avail 5 custom illustration requests per month
Request new template styles
Slides and Presentations feature
Literature
recommender
Research
skill courses
Academic
writing assistant
Exclusive discounts on
Editage Services
358K+ Academics love Mind the Graph
The world's largest gallery of scientifically accurate illustrations
Over 75,000 accurate scientific figures to boost your impact. As scientists ourselves,
we know the difference between a rat and a mouse!
Your creations, ready within minutes!
Drag & Drop
Easily select and manage illustrations, text and templates.
Pre-Made Resources
Use our pre-made templates and just customize colors, text, etc.
Slide Presentations
Integrate information and illustrations into beautiful and impactful slides.
Multiple Sizing Options
Ready-to-go templates in all popular sizes.
On-demand Illustrations
Didn't find exactly what you need? We will illustrate it for you!
Online Platform
Access your creations at any time and from anywhere.
Frequently Asked Questions
- 01
Can I publish infographics I create with Mind the Graph? How do I cite them?
All content stored in and created with mindthegraph.com is available under a free culture Creative Commons license. Free users can publicly present infographics created with the Mind the Graph platform and use the illustrations available on the website. However, Mind The Graph must be cited, and the use of the watermark is mandatory. Paid subscribers are recognized as authors and are entitled to full rights to their creations, with the rights and ability to transfer authorial rights to third-party publishers without previous consulting Mind The Graph. So, if you're a paid subscriber, you don't need to attribute credit to Mind the Graph (but we'll be happy if you do!). - 02
Can I use Mind the Graph for free?
Yes, Mind the Graph is based on a freemium model and you can use it for free for as long as you wish. We don't request any credit card information upon registration. However, keep in mind that the Free plan is for you to get to know the platform and informal communication with your peers or educational environments. As a free user, you must retain Mind the Graph's watermark in all cases and cite the platform in formal communication, publications, lectures, and presentations. If you ever want to upgrade, all paid plans provide access to more figures, watermark-free images, Creative Commons licenses for your creations, and unlimited high-resolution exports in PNG, PDF, and TIFF formats. - 03
Do I need to pay to request an illustration?
Mind the Graph is the world's largest scientifically accurate illustrations gallery. There are chances that we have the illustration you are looking for. However, if we still don't have an illustration that meets your needs, you can subscribe and request it for free. Check our tutorial for help. - 04
What are the benefits of a paid plan?
A Paid plan at Mind the Graph gets you extra features and resources! All paid plans offer a wider range of illustrations, watermark-free use of images, Creative Commons licenses for your creations, and unlimited high-resolution exports in PNG, PDF, and TIFF formats, and Creative Commons licenses for your creations. Also, you'll have access to premium customer support, free personalized illustrations, numerous templates, and higher limits on the use of scientific illustrations. Don't forget to compare plans here. - 05
What is the best free infographic maker? And why is it Mind the Graph?
Mind The Graph is the best free infographic maker for you. First, you can use Mind The Graph for free with no time limit and no payment method required. As a free user, you can also publish your graphical abstracts, scientific figures, and presentations in journals, magazines, blogs, social media, books, and more (but remember that you'll have to keep the watermark and cite Mind the Graph as the visual content resource). You have access to the world's largest gallery of scientifically accurate illustrations and can change the colors, crop, add text, and many other editing tools in your creation. And if you don't know how to start, there are +300 templates to create in Abstract, A4, Poster, or even a custom size you prefer. - 06
What are infographic templates?
Infographic templates are ready-to-edit infographics created by our design team. You can use them as inspiration or start-point for your creations. - 07
Where can I get free infographic templates?
You can get free infographic templates here in our infographic template tab. - 08
How do I make an infographic template?
To make an infographic template you’ll need an account at Mind the Graph and some creativity to start creating. Click here and learn simple steps to create an eye-catching infographic. - 09
What are the 7 types of infographics?
The 7 types of infographics are: statistical, timelines, processes, comparisons, lists, geographic, and informational. You can learn more about the difference between infographics and graphical abstract here.
