INFOGRAPHIC :[Downloadable] 9 Steps to create an infographic for your manuscript
![[Downloadable] 9 Steps to create an infographic for your manuscript](https://www.editage.com/insights/wp-content/uploads/2022/11/presentation-1559937_960_720-1.png)
Visual elements play a vital role in your research. They enable you to present complex data in a simplified manner that further allows readers to engage with your research. Powerful and comprehensible visuals also help you gain more visibility among funders and institutions, and gain more citations.

Here’s a downloadable visual guide by Mind the Graph, a free online platform that allows you to create beautiful infographics in a few simple steps.

Download it now!
MTG_Steps to create an infographic scaled.jpg
Related post
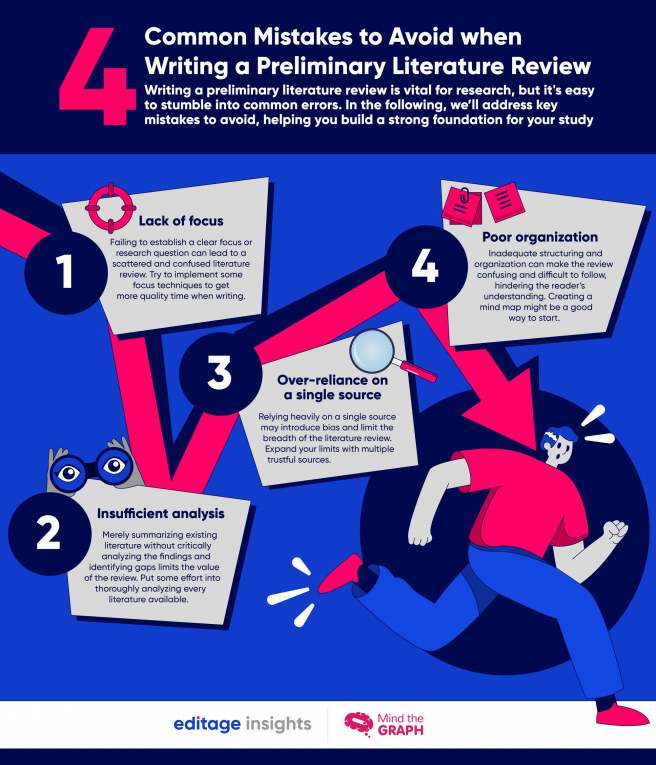
4 Common mistakes to avoid when writing...
June 7, 2024
Powerful ways to tackle missing data
May 14, 2024